Tangible Algorithm
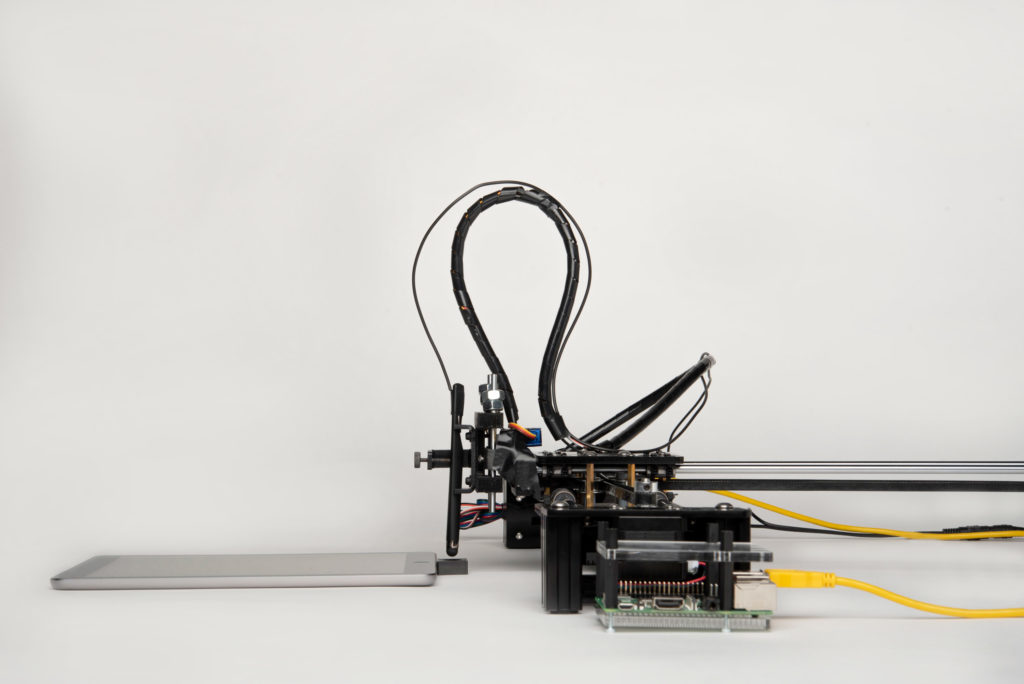
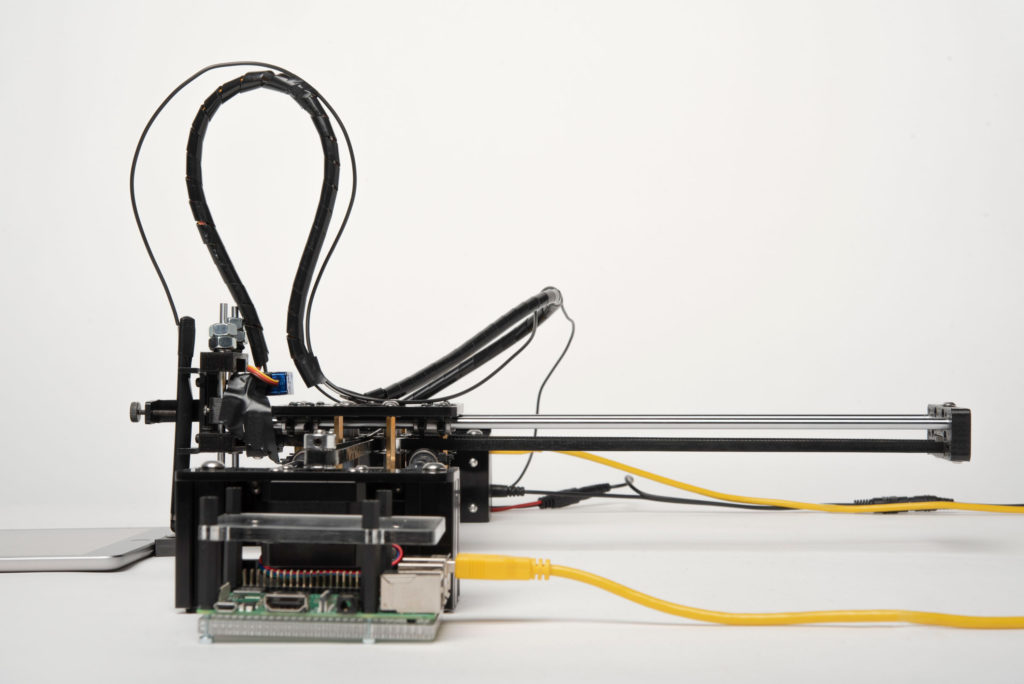
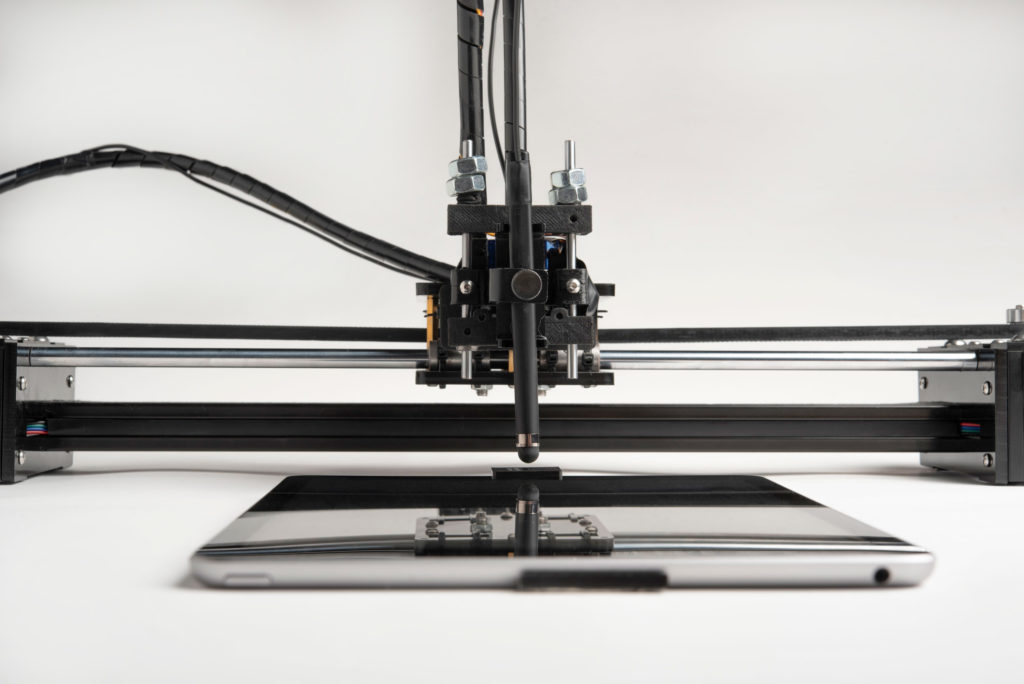
A physical, tangible representation of an image classification algorithm and the translation of its operations in a concrete, visible form. Mechanical, automatic and repetitive actions, where the computer describes a photograph in the form of code and generated captions, identifying the components of the images.
The human eye cannot understand completely the meaning of its actions, but its effects lead to the identification of the image metadata, understanding what is in the picture and categorising it, after a specific Machine Learning training. The output in a sensitive content detector is a censorship of a certain categories of pictures, labeled as a not eligible for the social media platform where it is applied.
Video
Promotional Video
Selected images

Concept
Our concept inspiration started reflecting on the theme of the exhibition – Exposed. One of our first approaches and interests was to understand what is unexposed, hidden, in the modern conception of photography.
Photography, by its nature, is a tangible and unequivocal proof that a moment has happened (Barthes, 1980). Thinking about its evolution in the digital age, images are now produced with a much greater frequency and in much greater quantities, thanks to the ease with which they can be captured. They became ephemeral, fast and result of the freedom of expression, without limitations and often without a real purpose. The use of such a large quantity of visual content is no longer dictated and regulated by the human being, but by the machine; every digital image has metadata, i.e. information that identifies and differentiates it from others. Algorithms that, far from our eyes, read and analyze this information and classify the images.
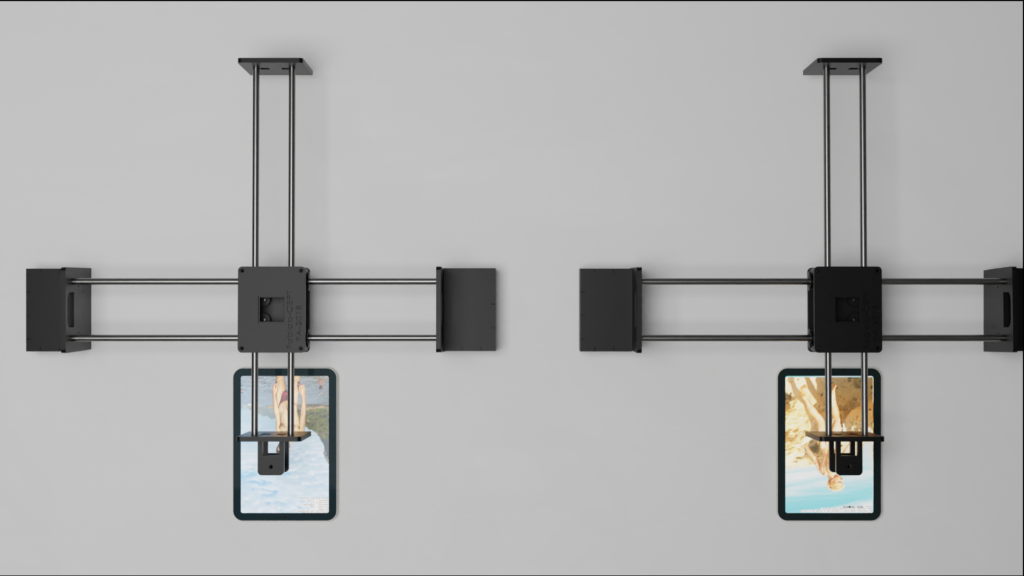
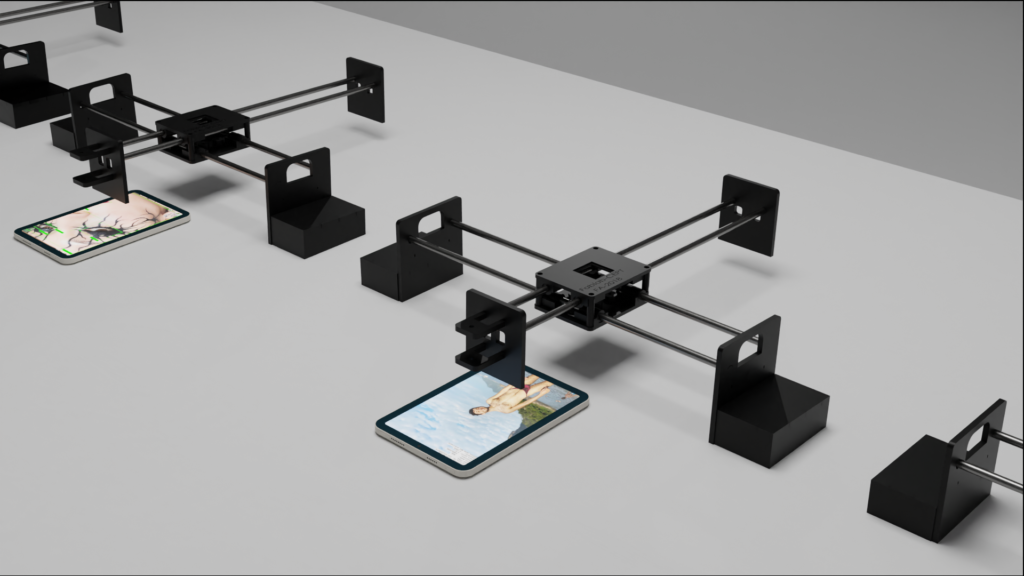
The idea of our installation aims to make tangible the algorithm and computer vision steps, expose the actions that read and categorise images, through the repetitive work of robots. Under each robot, a tablet will show a different picture and what happens when the algorithm has to analyse it: metadata extraction, object recognition and classification (through a pre-trained Machine Learning model) and final decision, if the content needs to be censored or not.
The aim is to make the visitor aware of automatic mechanisms, as well as raise questions about them: who manages these algorithms? How do they work and how were they trained? Who defines and decides how to categorize the contents submitted to them? Behind an apparent automation, in fact, there is a model trained by Man, from a selected and categorised dataset, which creates censorship that is not always justified and biases.
Context
EXPOSED – Torino Foto Festival is in its first edition of the new international photography festival in the Piedmont Region capital. The theme is New Landscapes and will be held between 2 May and 2 June 2024. The project presented in this dossier is part of a collaboration between MAInD SUPSI (Switzerland) and the Torino Foto Festival, during the Prototyping Interactive Installation course. The aim was to create an installation focusing on a current conception of photography in the digital age. The brief for this installation was following 4 main points:
– the installation must run for the entire month of the festival;
– the installation aims to showcase multimedia content (images, videos, sounds) and its meta-data;
– the installation must be controlled by one or more smartphones (on site or remotely);
– the installation can be: provocative, investigative, poetic, functional, collaborative, didactic, artistic.
Prototyping
Research
We started our project with a research phase, to better understand the brief we received and the possibilities to be explored. First, we defined the possible sensors to be used from the browser, the interactions from mobile and the main metadata we could have from a picture or video.
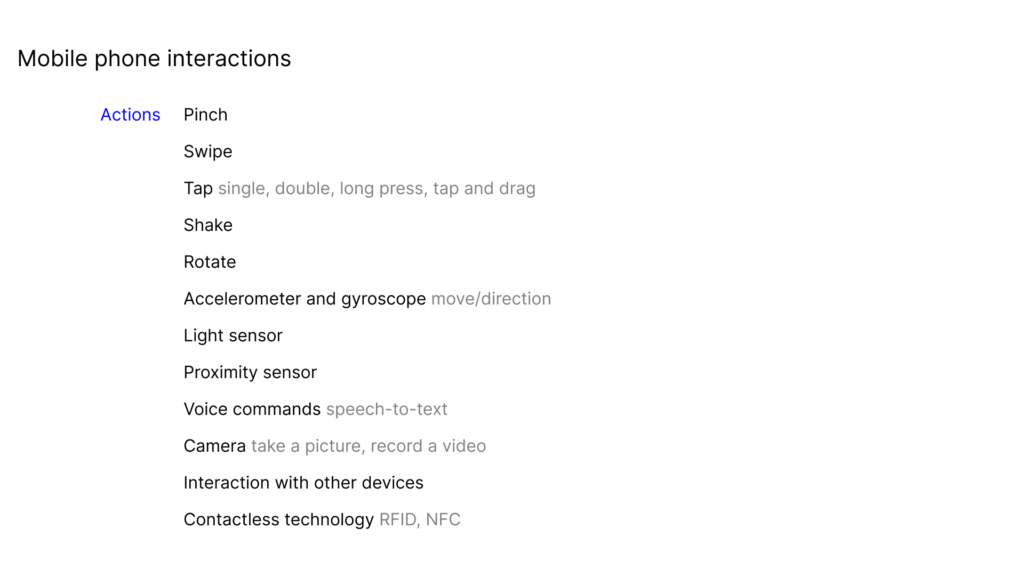
Mobile phone interactions
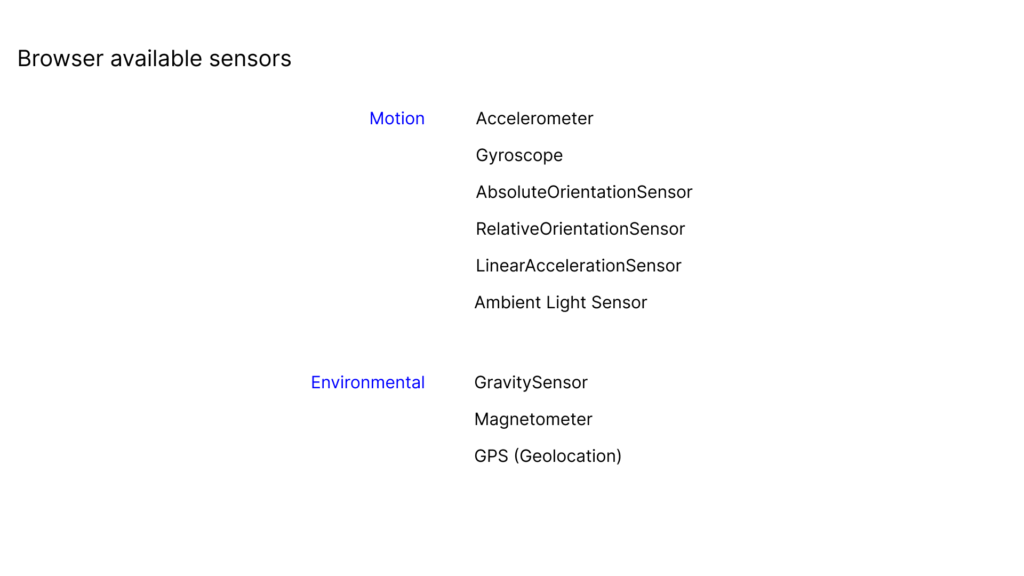
Browser available sensors.
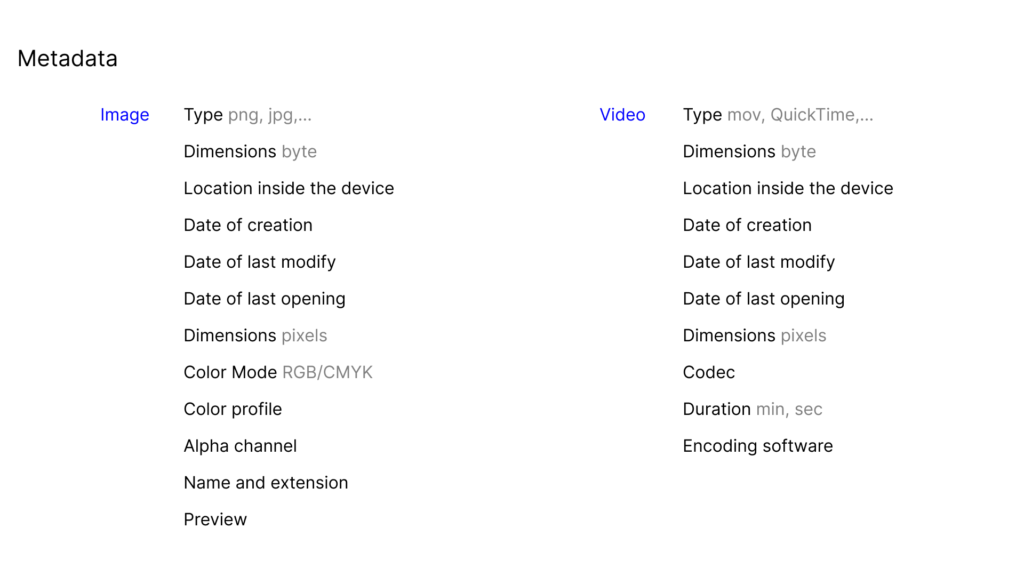
Metadata.
Following, we researched some case-studies that could help us expand possibilities and explore what has already been done on this topic.
Unnumbered Sparks – Janet Echelman and Aaron Koblin
Data-verse trilogy – Ryoji Ikeda
Symphony in Acid – Ksawery, in collaboration with Max Cooper
Sisyphus – Kachi Chan
This is not Morgan Freeman – Diep Nep
The Center for Counter-Productive Robotics – Ecal
The Follower – Dries Deporteer
https://driesdepoorter.be/thefollower/
Idea generation
After an initial phase of research and analysis of the case studies found, we continued our journey by generating ideas and reasoning about different concepts including meta-data as the main subject and their possible interpretation and visualisation.
We had multiple concept that we found interesting, but discussing together we decided to converge into physical solutions. Showing metadata and information that are hidden in digital images was a concept present in all the ideas we came up with, but we were also intrigued to be able to show something else, to expose the unexposed.
Final idea
The final idea we defined is to make a physical representation of the algorithm that manages a sensitive content detection and censorship.
Why? To make the algorithm tangible and expose the arbitrary decisions regarding the censoring of images. Show how the contents that we share are no more just pictures, but a mine of data and information.
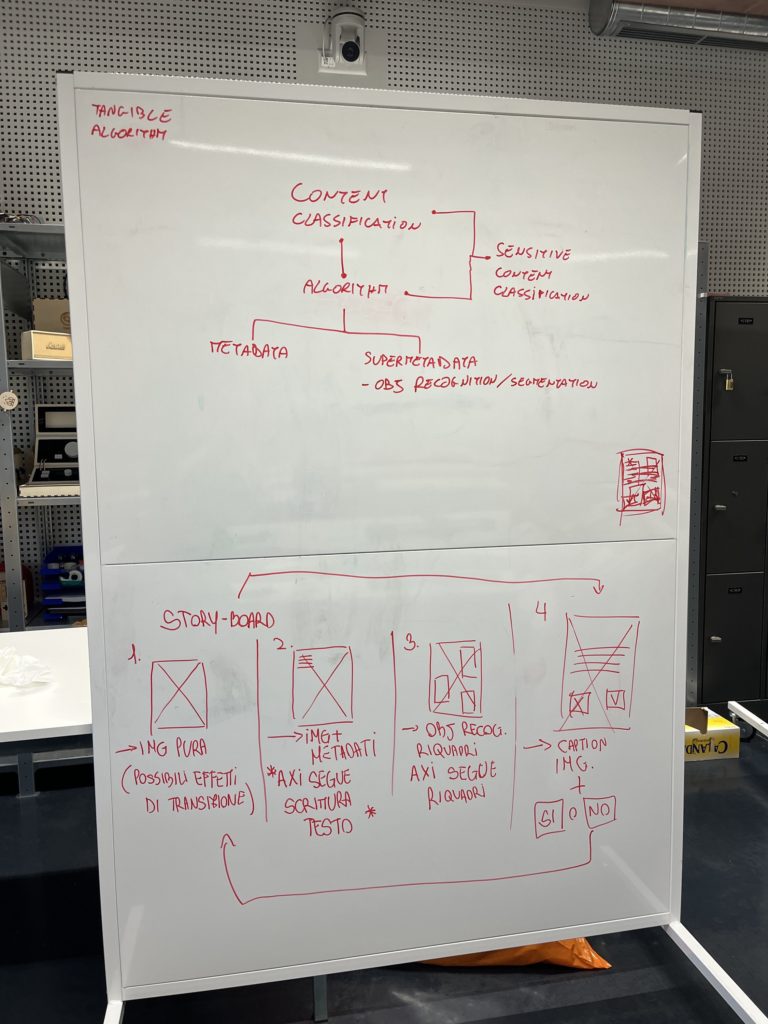
Before jumping into programming and content creation, we defined the main topics and a storyboard of our visual journey. The aim was to start the project with a clear direction to take, which was flexible in case of unforeseen events, but at the same time allowed to prevent any errors.
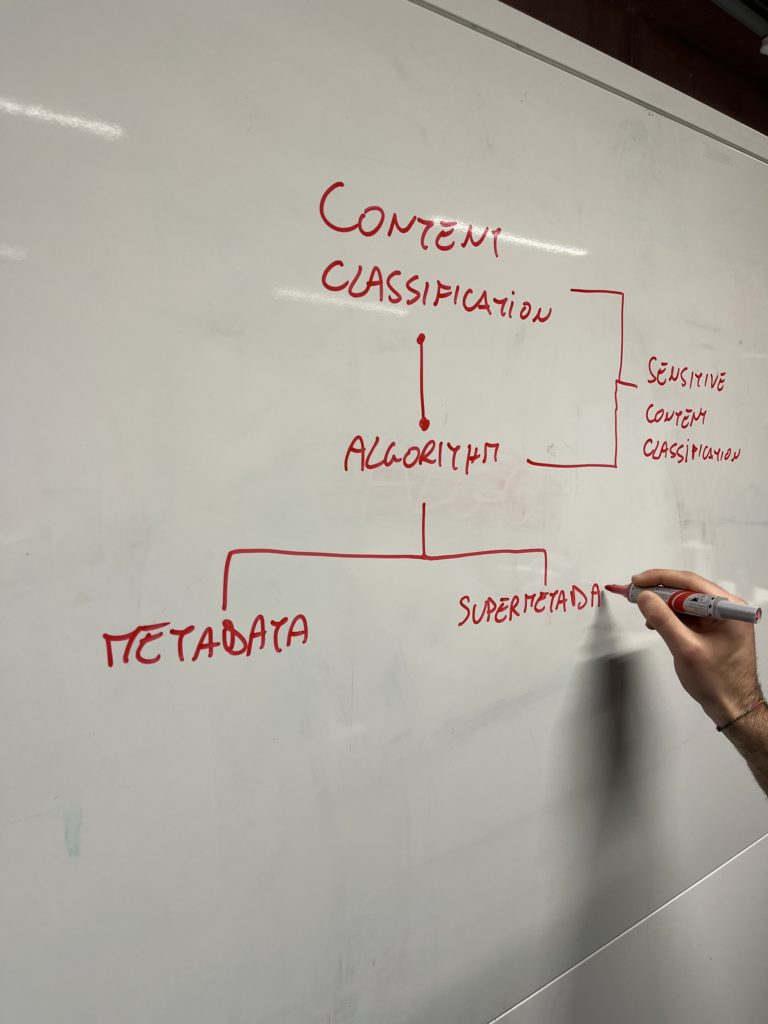
Different concepts involved.
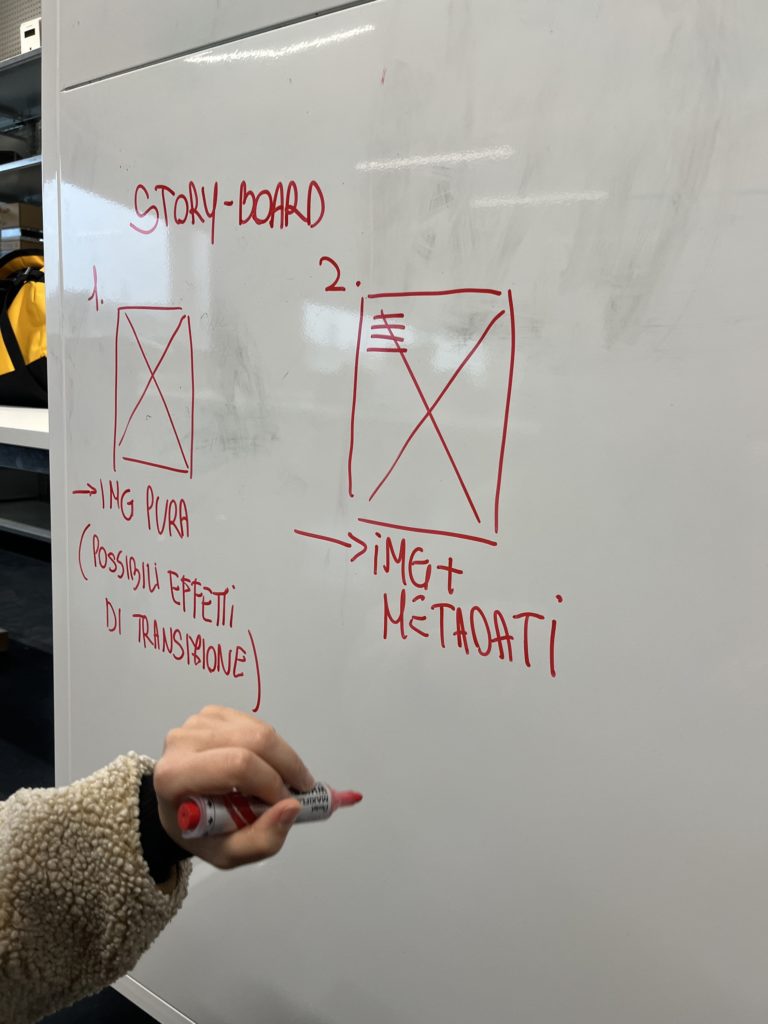
Visual part storyboard.
Final structure.
The different parts involved are: the pen plotter (AxiDraw); the visual – composed by the dataset selected and the typography overlay layer, showing on a tablet; the Machine Learning model; the audio.
For the visual parts, the path that is repeated as each image changes is divided into 4 stages:
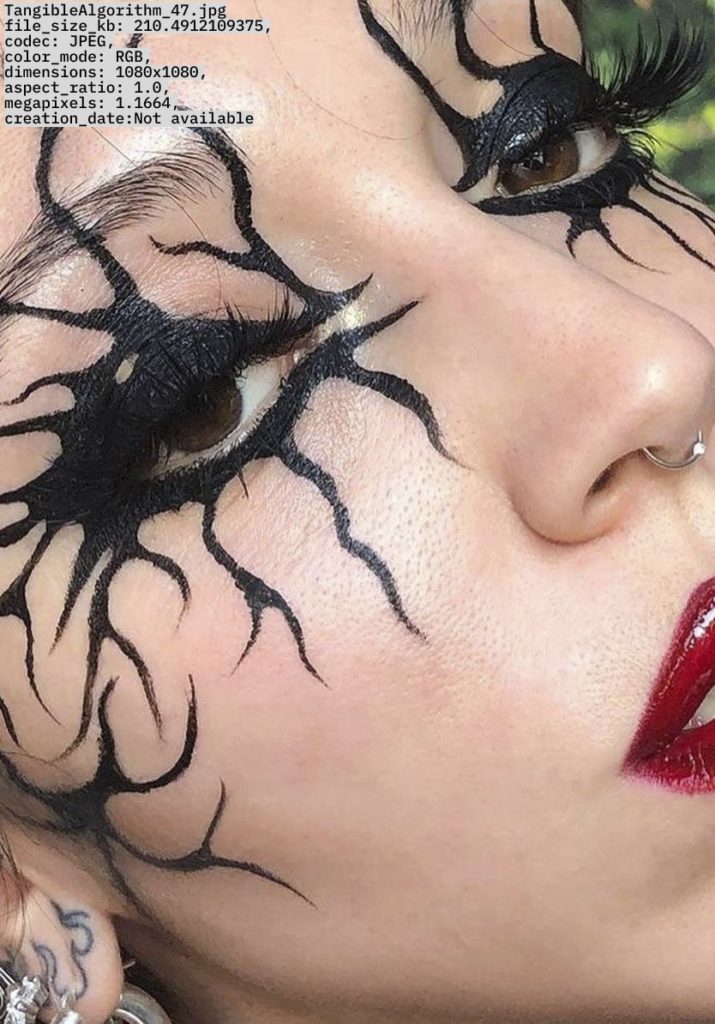
– metadata: appearance in the form of text, from top to bottom, of the photograph;
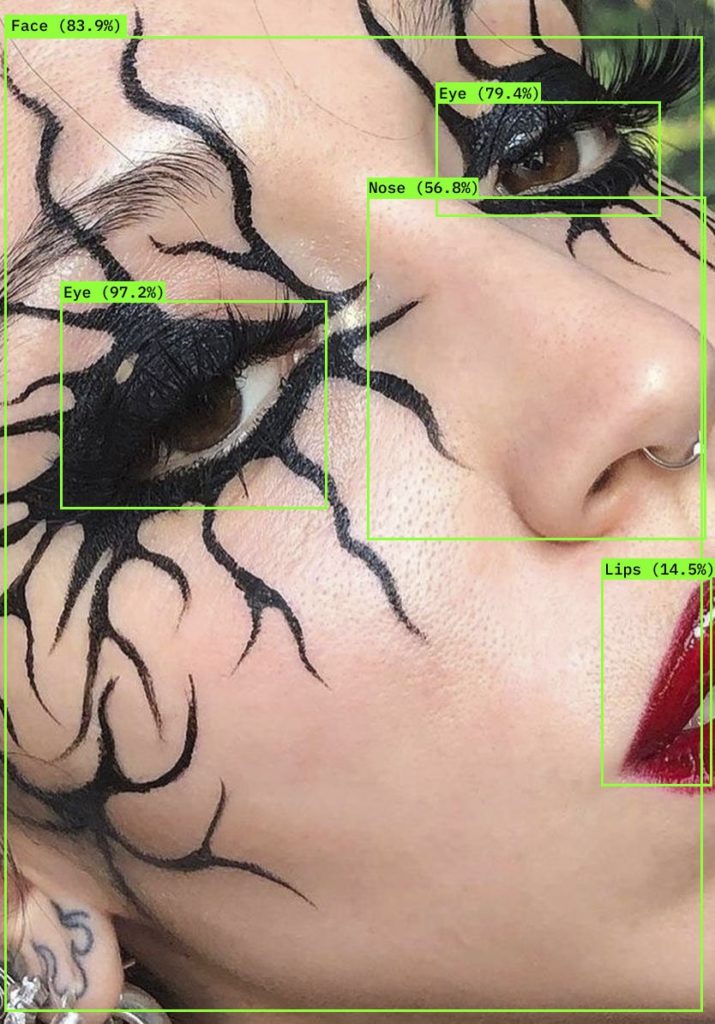
– object recognition: recognition of subjects within the image thanks to computer vision, through contours with coloured rectangles and a label;
– caption: a generated caption describing the image with a sentence and two buttons, over which the robot moves to decide whether the image is ‘safe’ or ‘not safe’;
– a state of confirmation of the choice, such as feedback, where an eye or a crossed out eye and a blur overlay appears in overlay to the image, depending on the choice made.
Initially, we thought of managing the movements of the pen plotter and having it move at the different bounding boxes of the recognised objects. After discussing the code structure, we realised that too many variables were involved, making the whole operation risky, subject to too many unforeseen events and too large margins of error. We decided to simplify it, keeping a starting and ending point for the pen to move from/to, but having random movements in between (on the object recognition phase), keeping “real” and effective the most important part: the final categorisation.

Time managing for the different parts.
Machine Learning
The recognition of subjects within the images is implemented by a model we have built of object recognition using Machine Learning, which combines three different models to detect different categories of elements.
– YOLO detection: to detect common and harmless subjects, such as people, books, remote controls.
– Nude detection: to detect nude parts of the body.
– NSFW detection: to detect explicit content.
The combination of these models allowed us to have a recognition of different subjects and the classification of images according to their content into “safe” and “not safe”.
The aesthetics of subject recognition through object recognition uses coloured rectangles with labels on them to identify the occupation area of certain subjects and the probability of rightness of this recognition. We decided to keep the same aesthetic solutions, as they are intriguing and functional to the representation of the concept. Each of the models is identified with a different color – green, red and violet respectively.
Database
The use of a database is essential to manage and synchronise the various components of the installation. We used Supabase as a tool to record the start of the code through the button (start), categorisation of the image (safe or not), state of the image (current state) and the image index.
Thanks to a code in Python, we managed the start-up and movements of the AxiDraw, with its coordinates in G code.
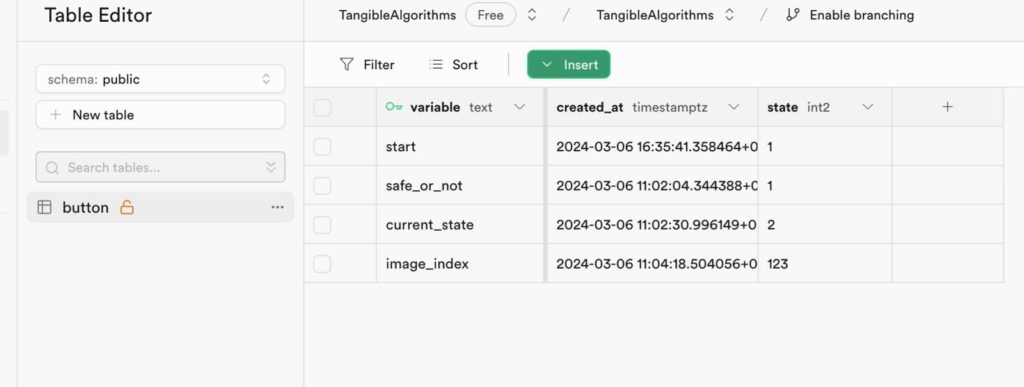
Supabase parameters.
GPT4 Vision
GPT4 Vision was used to generate the caption of the images. This step is crucial to determinate, combined with the object recognition, the state of the picture – if it is safe or not.
Pen plotter
The algorithm for characterising images according to their content is represented by a pen plotter, which moves without interruption and automatically. The movements of this machine are managed by coordinates written in G-code, where the X and Y coordinates of a point are defined.
The starting point (Home) of the tip is defined as the first co-ordinate. Subsequent movements can then be defined either absolutely (based on the Home) or relatively, i.e. marking a movement based on the previous co-ordinate. We decided to work in an absolute manner and define the Home co-ordinate at the middle and bottom point of the tablet above which the pen plotter moves.
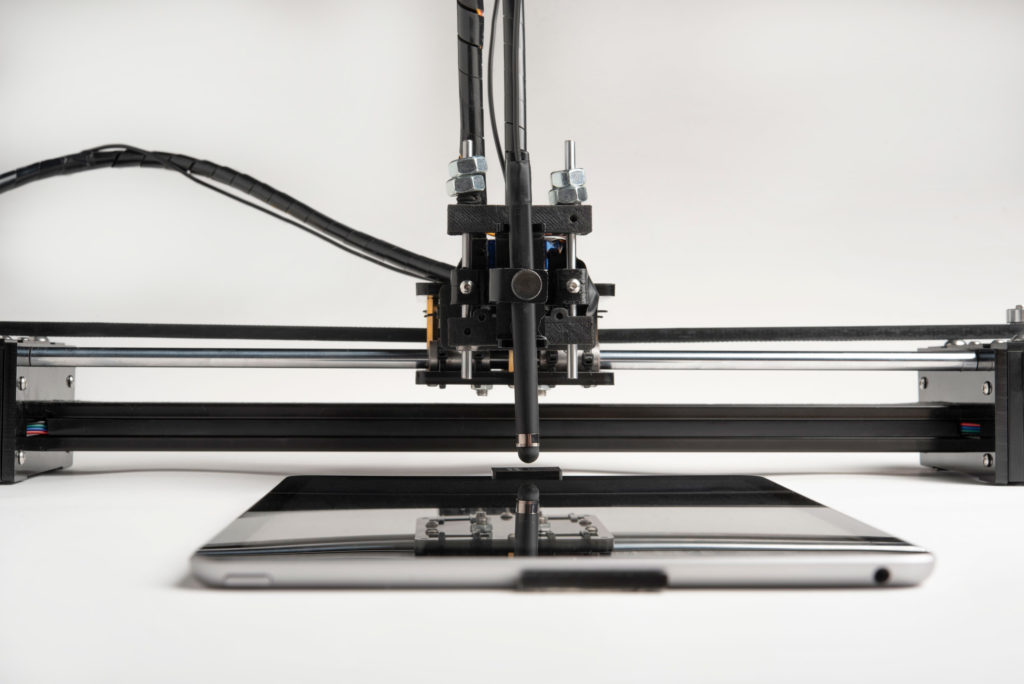
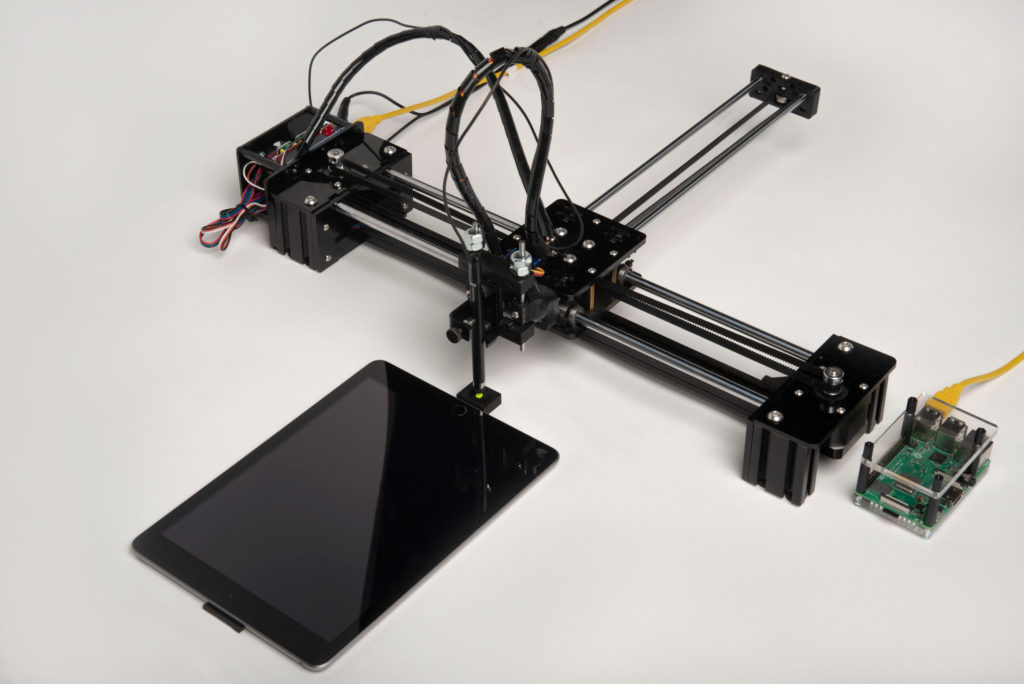
The pen plotter we used is an AxiDraw. Movement on the X and Y axis is dictated by movement along two mechanical axes, through the movement of belts. Movement on the Z axis, on the other hand, is controlled by the movement of a servo motor, which turns a propeller and causes the head to move.
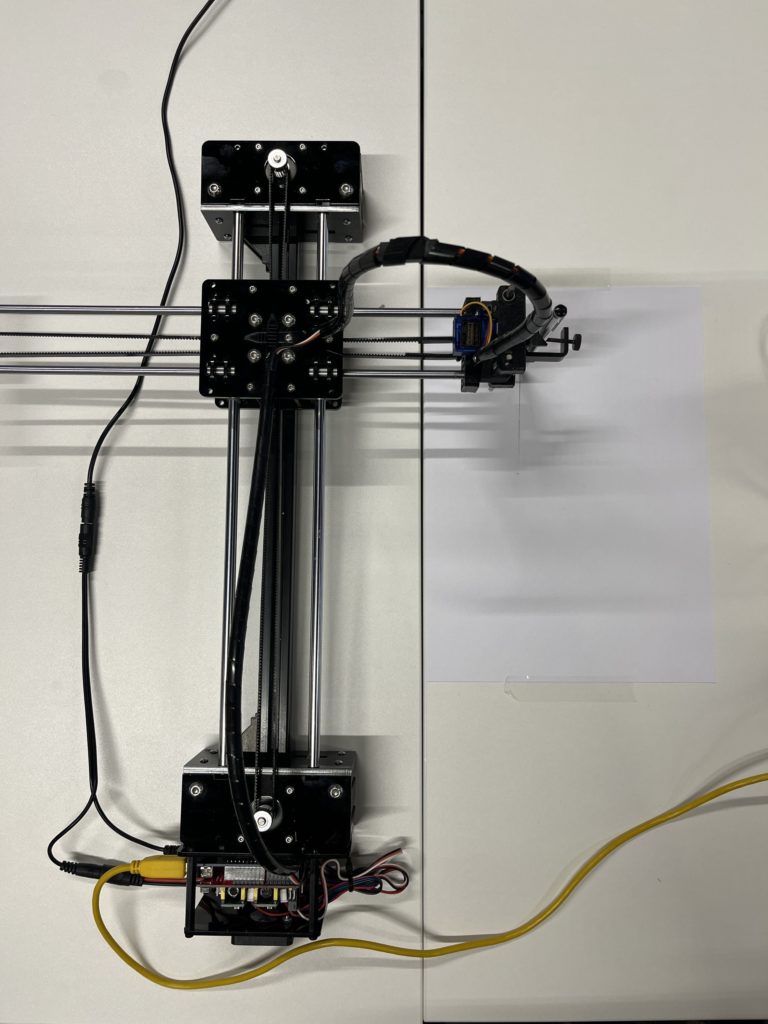
The pen plotter we used for our project.
After having understood the operation of the machine and the management of its coordinates, we adjusted its movements and defined the movements to be made at each image: an initial movement from the Home towards the top left corner, a vertical descent to the centre of the iPad, a series of random coordinates at the moment of object recognition and a return to the Home. Next, a movement from the Home to the button corresponding to the state of the image (safe/not safe). The movements were defined from the beginning of the design and during the various phases, adapted to the state of the project and calibrated according to the situation.
The final action of the pen plotter, after moving to simulate an analysis of the image, is to move to the button that characterises the image as “safe” or “not safe”. Thanks to the Z-axis movement, it is possible to use it to press a button on the tablet interface and then return to the Home screen.
Creative solutions
During the use of the machine, we encountered numerous faults in it: some parts did not have the right friction, the pen was not heavy enough to actuate the touch screen and the touch pen wasn’t working. For each of the problems we encountered, we found creative solutions.
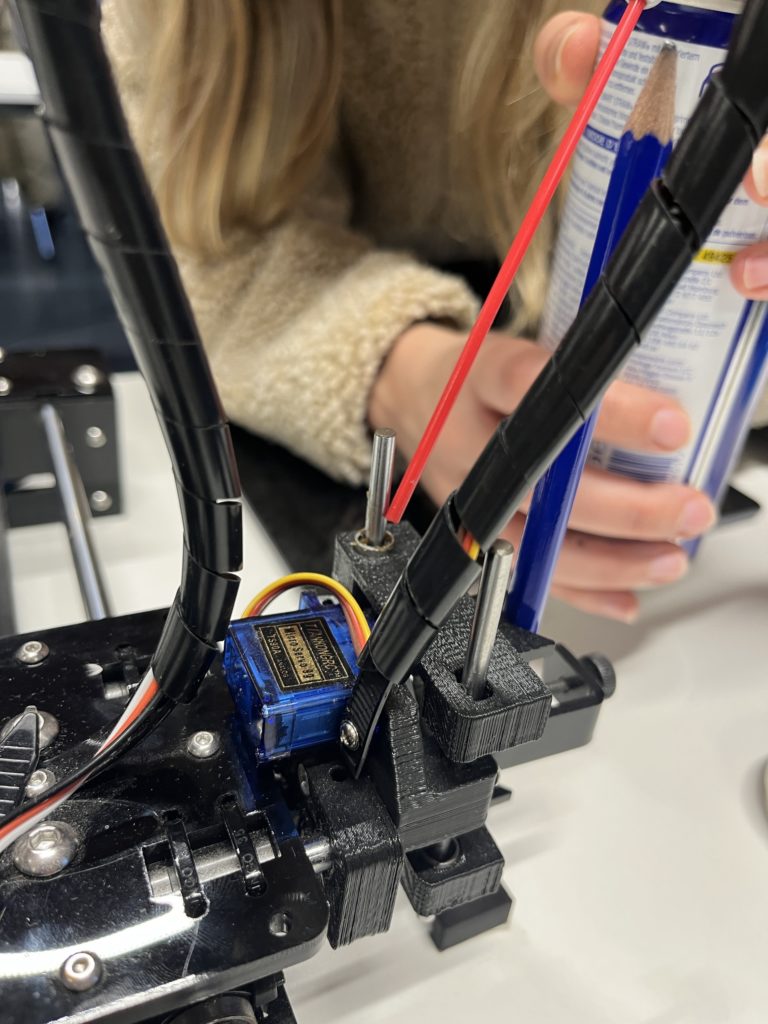
We lubricated parts to avoid friction.
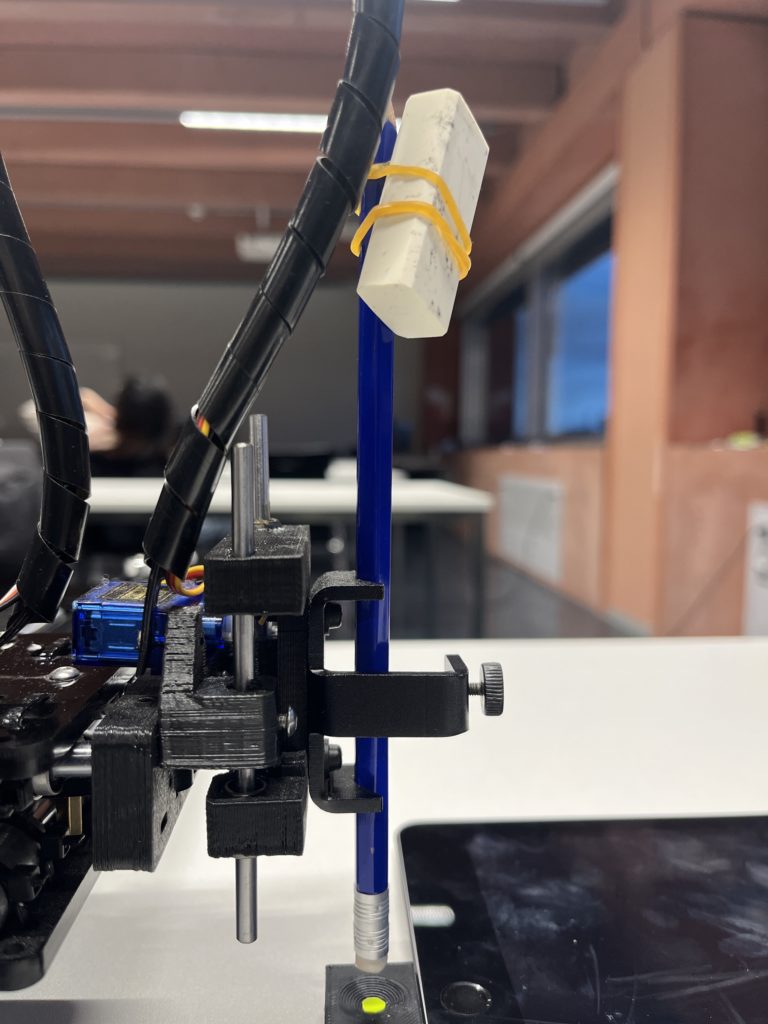
We added weight (a rubber) to the pencil, to simulate the right movement.
We inserted a touch pen in the appropriate position and tested it, we found that although the movement was correct, the button was not pressed. After numerous tests – enlarging the sensitive surface of the button, changing the position of the pen, changing the movement co-ordinates – we realised that the pen became sensitive to the screen when touched by a person. We replaced the need for static electricity through human contact with an antenna, created with a copper cable attached directly to the pen.

We created an antenna for the touch pen, to make it work.
The pen wasn’t working perfectly with this solution, so we attached the end of the antenna to the 12V on the Arduino board of the AxiDraw.
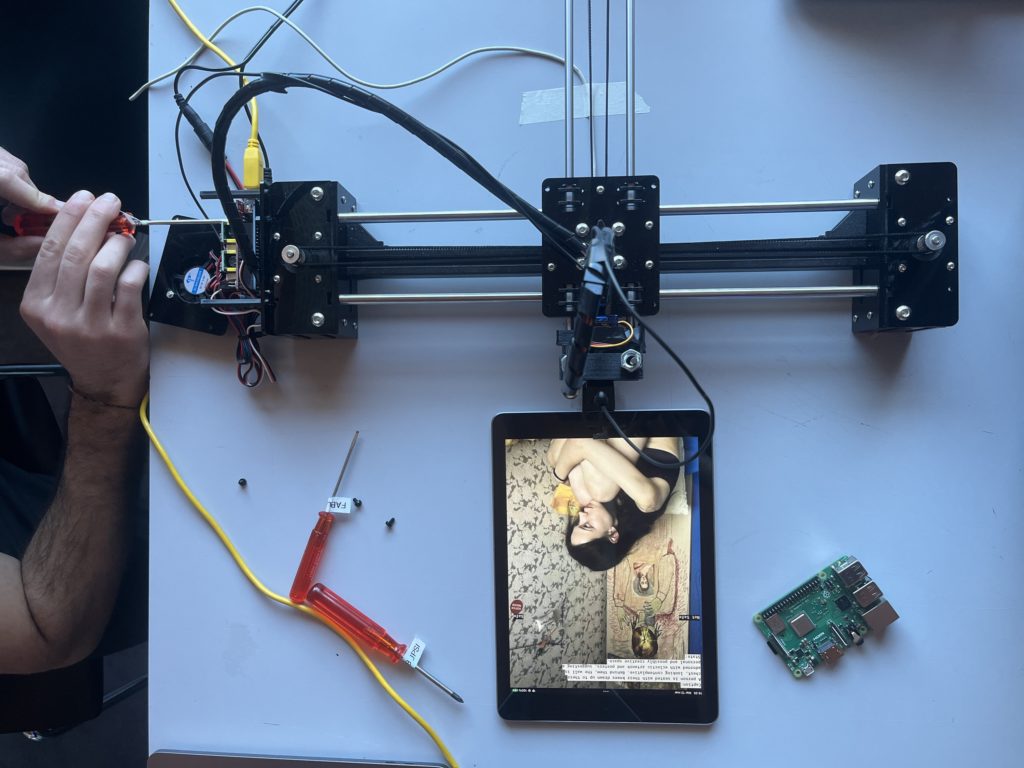
We attached the antenna to the 12 Volt.
During the documentation phase, also this solution wasn’t working as we needed, so we also added a copper layer on the point of the pen, connecting to the antenna.
Raspberry + Python
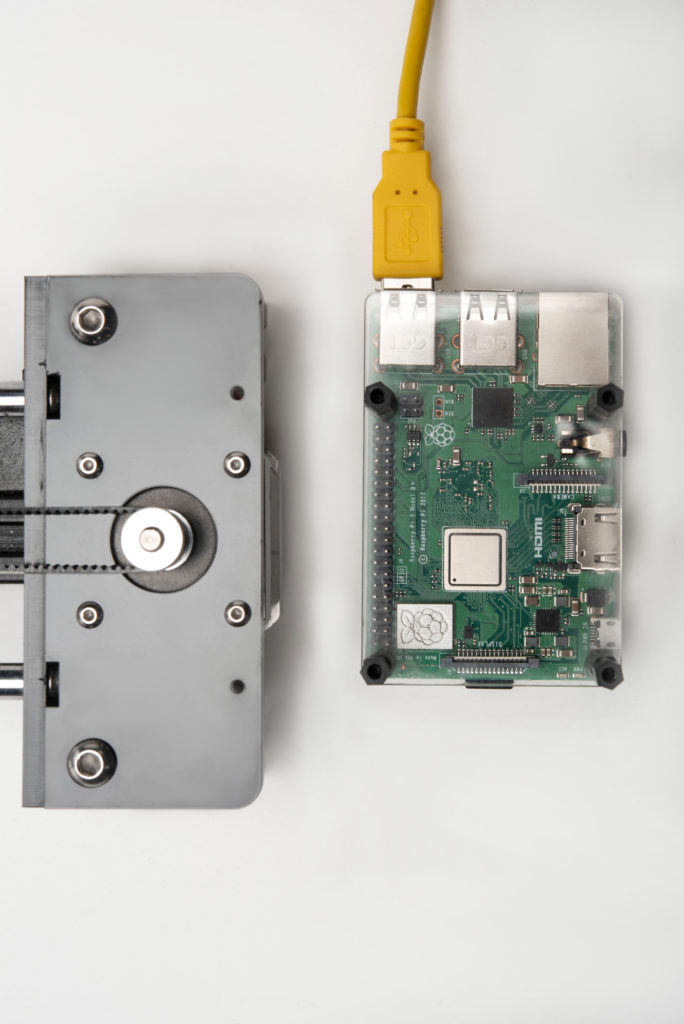
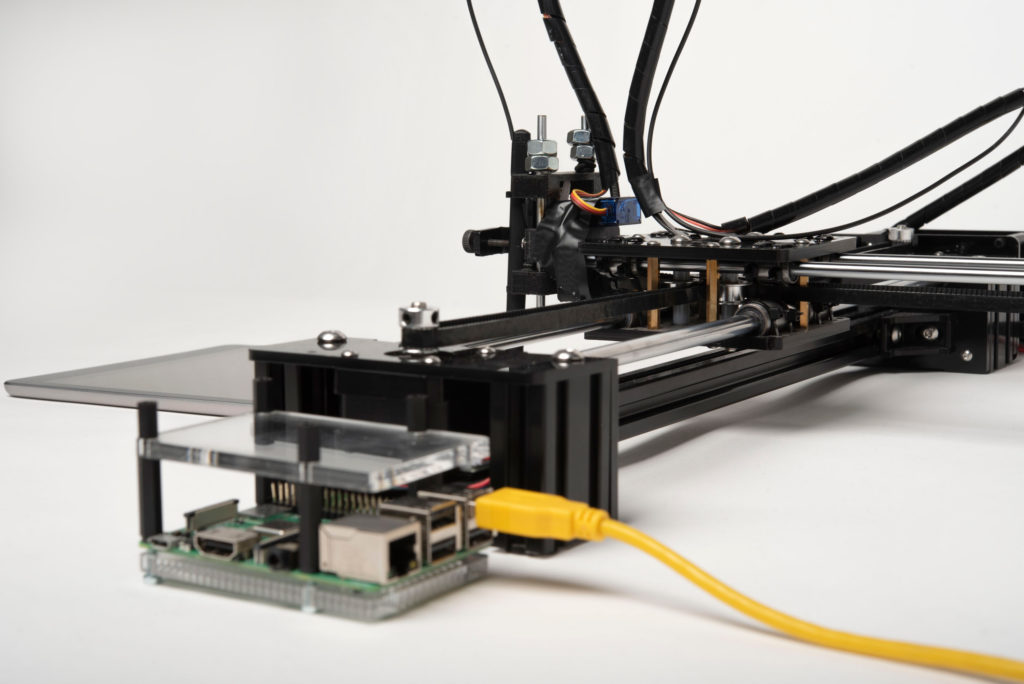
To make the installation running as smooth as possible, we wanted to avoid having a laptop to make the AxiDraw move. We decided to replace it with a Raspberry.
Using a serial communication, we uploaded the Python script on a Raspberry Pi to make the AxiDraw start moving when pressing a “Start” button on the tablet interface. This button will update the value on the real time database (Supabase) and when this value change, the AxiDraw will start moving – and the visual start running, accordingly.
Thanks to this solution, once the Raspberry (connected to the serial port of the AxiDraw) is plugged into the power supply, the Python code on it will start running; we set a delay of 8 seconds before it, to give the Raspberry the time to connect to the Wifi. To make the installation start, whoever would be responsible for it will only have to turn on the tablet, power the Raspberry and press the “Start” button.
Starting screen.
Dataset – Image selection
The selection of images was made by choosing potentially controversial images, where the boundary between ethical, explicit, safe and not-safe content was not clear-cut, even though their nature is often expressive or artistically derivative. The result is therefore uncertain, the content detected could be categorised as suitable or not.
The images were taken by scraping using Instaloader, a tool for downloading content from Instagram. The profiles from which we took the content are:
@ _thanyyyyyy
@bruisedbonez444
@disruptiveberlin
@erotocomatose
@hidden.ny
@sensitivecontentmag
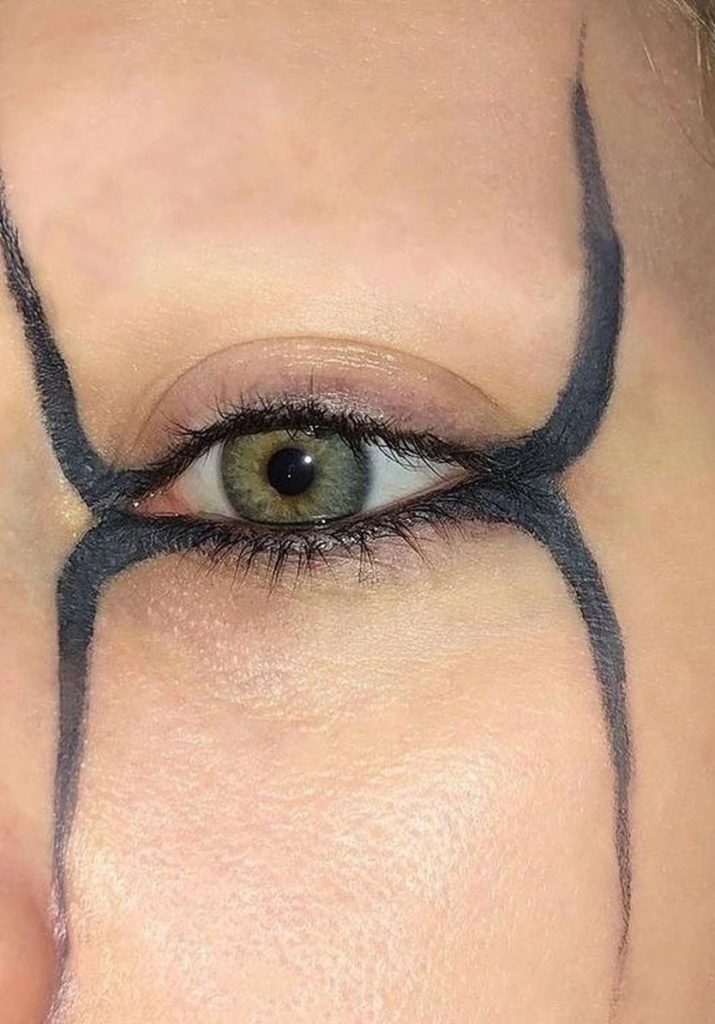

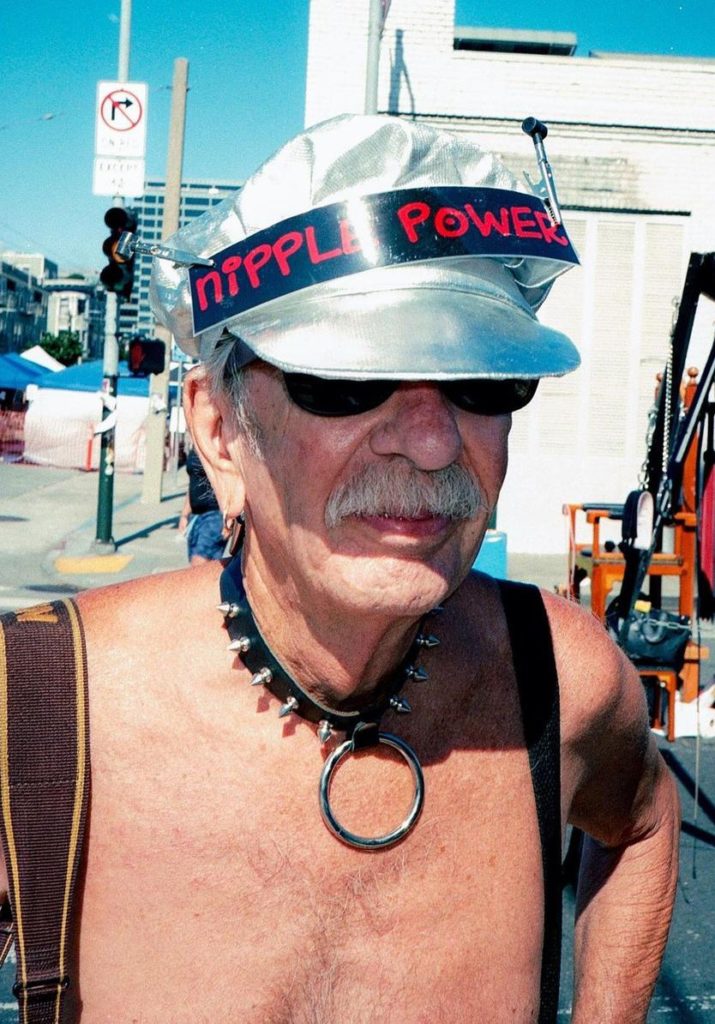
$ pip3 install instaloaderAfter scraping images from these profiles, we resized them proportionally to fit the dimensions of the tablet we planned to use for our prototype using a Python script.
Eliminating the pictures with text-only, in an horizontal format and not cohesive with the others, we finished with a selection of 394 images. During this process, it was inevitable thinking about censorship and biases: choosing the content to show would have an impact on what the people could see and what they couldn’t, both on the standard and the banned images. What is the message behind these choices? Is our selection too rigid or showing too explicit content? Are we avoiding a certain group of people, culture, nationality, creating a non-representative dataset? The discussion is open.
We are aware that time and resources are two main factors that allows to build an effective and representative dataset and we decided to start with 394 pictures and eventually increase the number in the future.
Dataset analyzed.
Visual
The visual intervention above the images is intended to be present but not disturbing in their visualisation and is composed of text. Its purpose is to make the algorithm’s actions understood: reading metadata, subject recognition, caption generation and choice of content categorisation (safe/not safe).
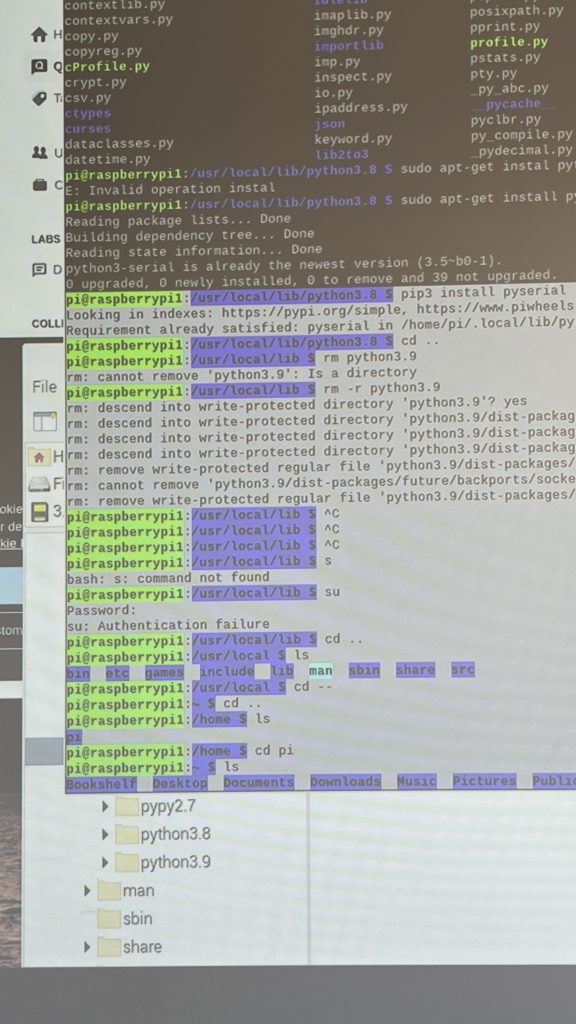
The intervention was mainly typographical, as if the information was written in a terminal. We took inspiration from the Raspberry terminal, while we were trying to understand how to make the Python file work.
Raspberry Pi terminal.
Minimal text formatting and left justification, with a gray block background, colourful bounding boxes for the object recognition and a monospaced font (IBM Plex Sans) are the main choices we took.
Metadata.
Object detection.
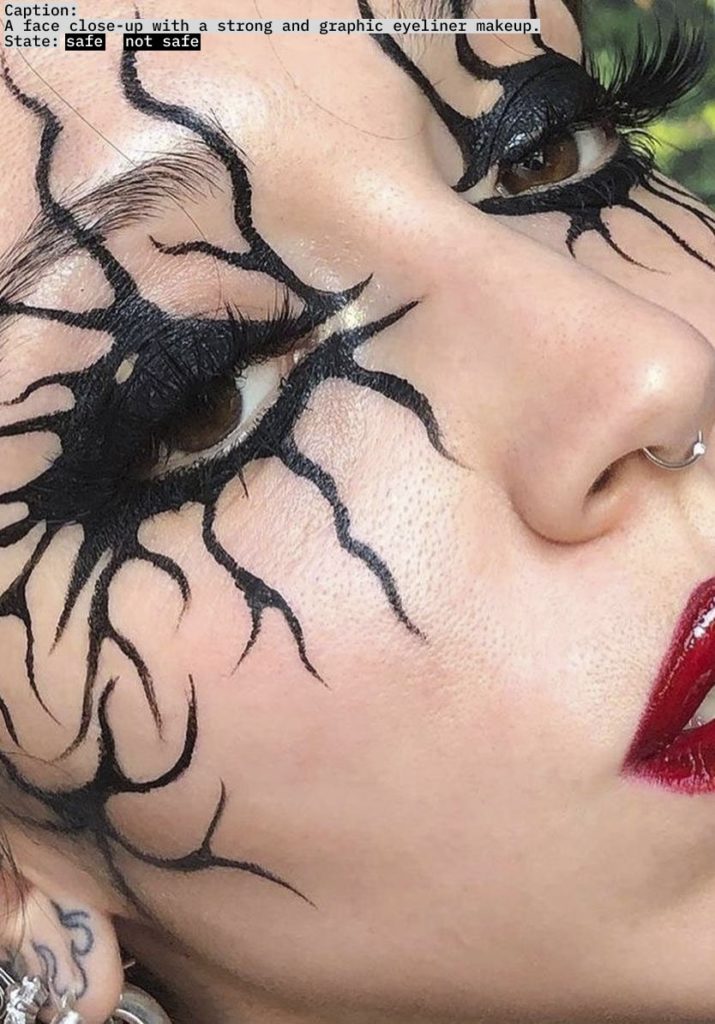
Caption.
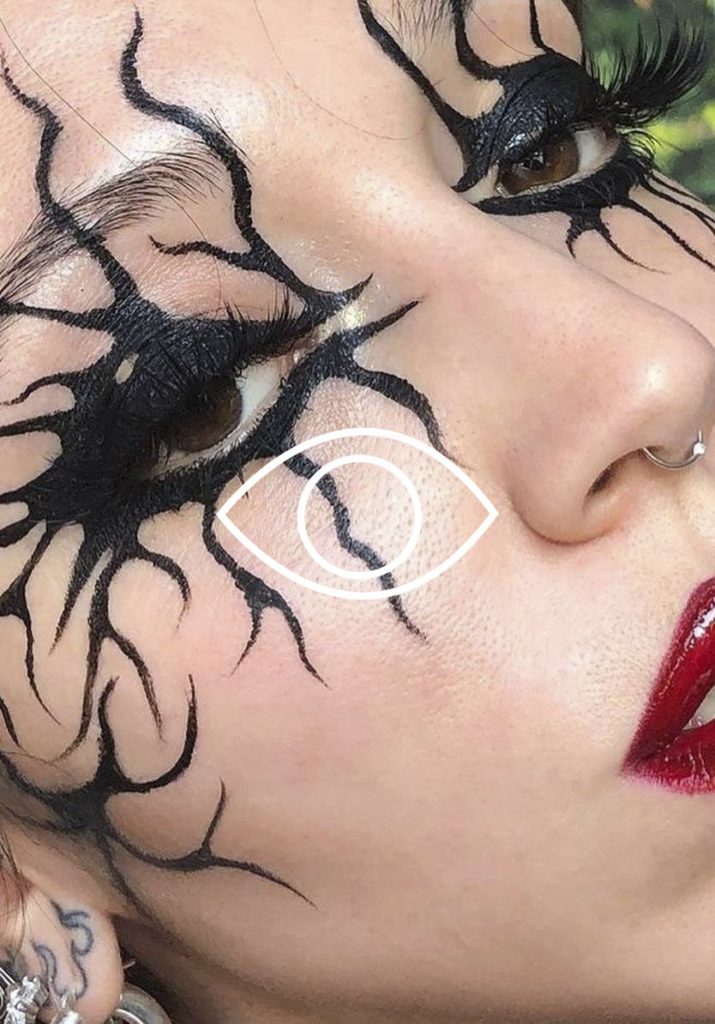
Final decision.
Audio
The pen plotters, in their movements, naturally produce mechanical sounds that also audibly reinforce the concept and echo the repetitiveness and monotony of their actions.
In addition to these sounds, to envelop the installation from the auditory side, we decided to add narrated text related to algorithms and machine rationalization. In our research, we identified a piece of content relevant to our installation: these are the transcribed notes of a lecture given over the radio by British mathematician Alan Turing (1912 – 1954), where he reflected and speculated about machines with intelligence of their own. There is no recording of the episode, but his typed and annotated notes have been pre-served and can be found in The Turing Digital Archive.
We transcript the notes using a character-recognise tool and after that, thanks to Eleven Labs – an AI voice generator and text to speech tool – we generate a man’s voice with a British accent, reading the notes. We edited the result to obtain a sound and acoustic similar to that of a 1950s radio recording (when the original interview took place).
Alan Turing voice editing.
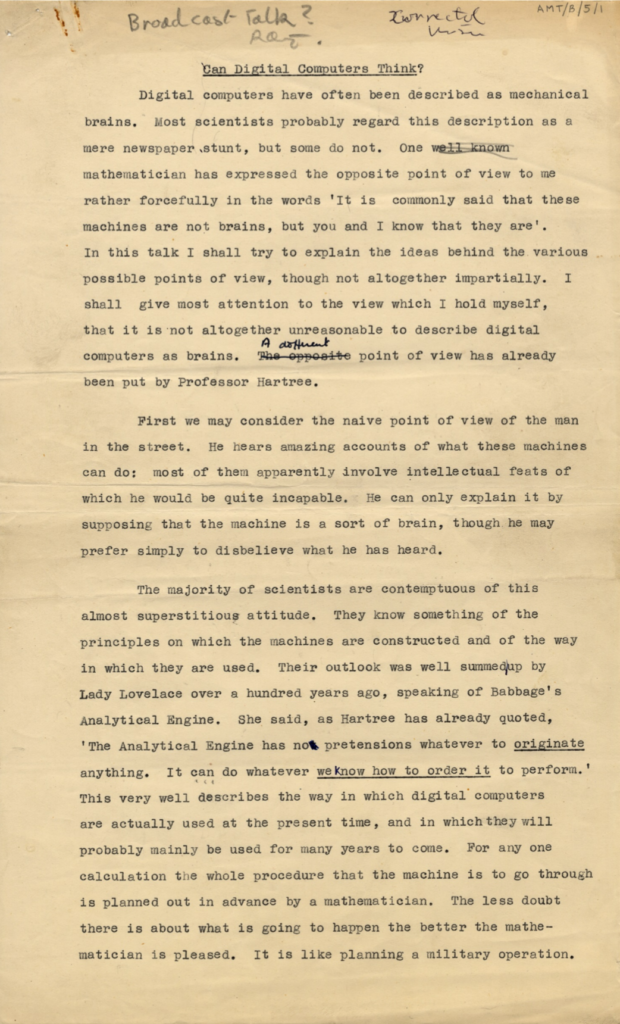
Alan Turing's notes.
Installation
Setup
For the installation setup, it was necessary for us to make the process as automated as possible. The database allows us to synchronise the changes in the visual with the movements of the pen plotter, as well as adjust its movement according to the state of the image (safe/not safe).
The code for adjusting the movements of the pen plotter is written in Python and loaded onto a Raspberry; it has been programmed so that its start-up determines the start-up of the code. In this way, the pen plotter is switched on and listens for the update of data on the database, to detect a change in the state of the button. When the “start” button on the interface visible on the tablet is pressed, a signal is sent to the database and consequently the pen plotter starts moving. Thanks to the start button, the Javascript code that governs the management of the visuals also starts, thus synchronising with the movement of the pen plotter.
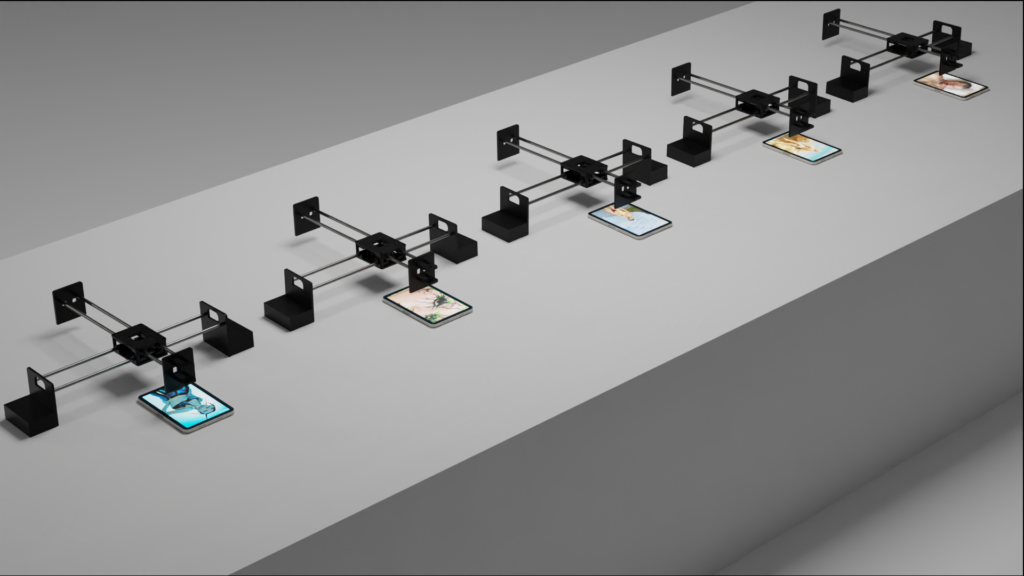
If the installation is chosen to participate in the Festival, our idea is to increase the number of robots and have 5 pen plotters moving. Having more robots available recreates an environment reminiscent of a factory, an industrial production.
Space
The planned exhibition space is Recontemporary, a cultural association and club for video art, and the first space in Italy dedicated exclusively to new media art where they promote multimedia exhibitions and artists.

Recontemporary, Turin.
To imagine the installation inside a room, we made 3D renders of an empty room, where the main and pregnant element in the space is the set of five AxiDraw machines with their tablets and structure to support them. The sound of the robots fills the space and their action is accompanied by the Alan Turing monologue.

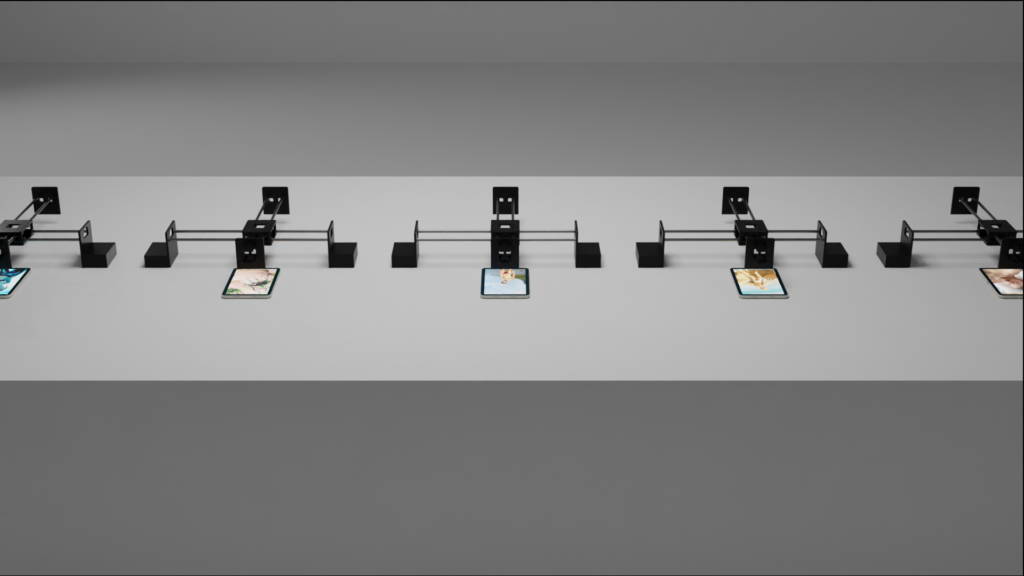

Additions
As support for the installation, we made small plastic supports to place the tablet in a fixed position, so that we could calibrate the pen plotter’s movements and make its Home physical, i.e. the starting and finishing point of its movements. The Home support survived until the end of the project.
Its structure allows to set the pen clearly on a specific point and allow to charge the tablet, thanks to the hole under it.
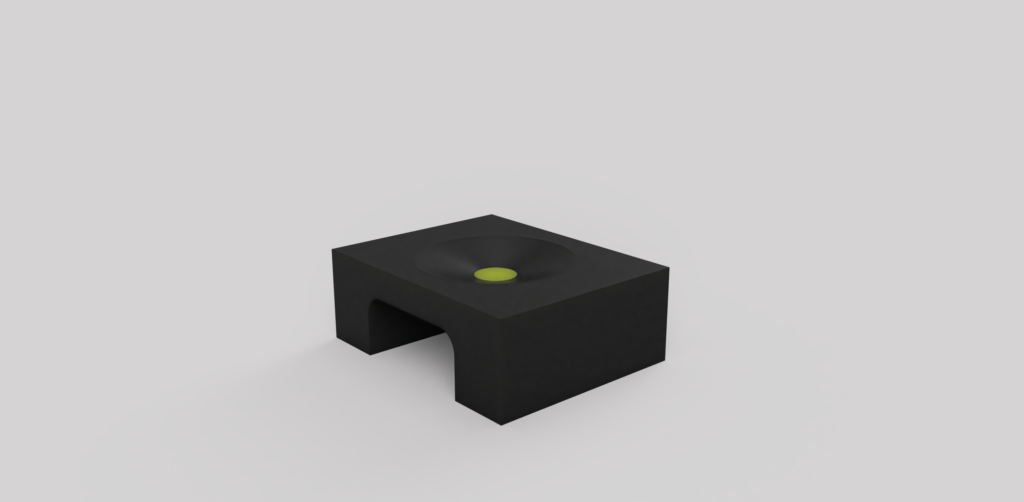
3D render of the Home.
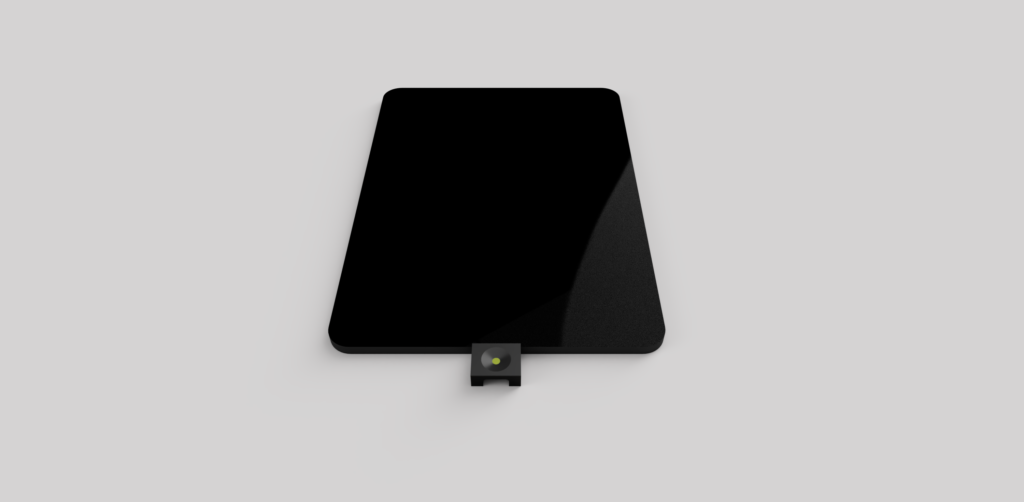
3D render of the Home, with the right positioning.
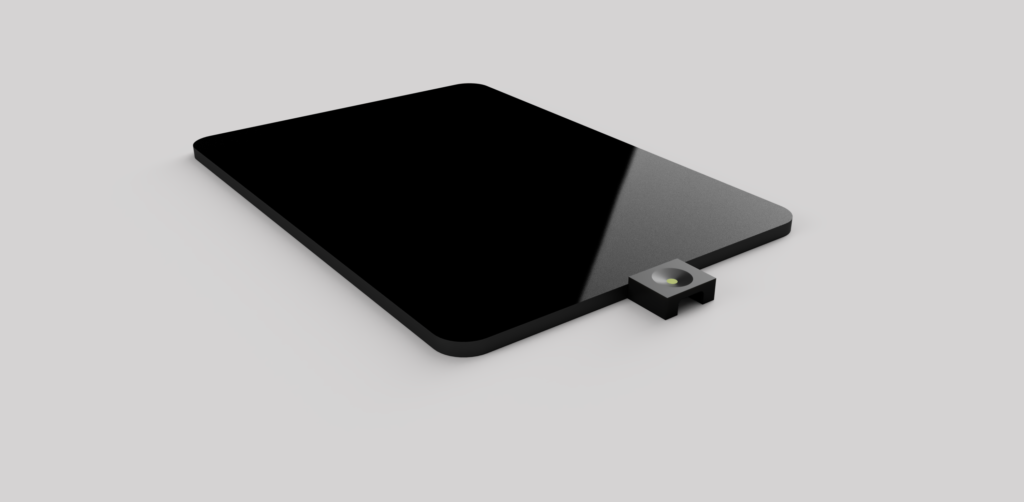
3D render of the Home, with the right positioning.
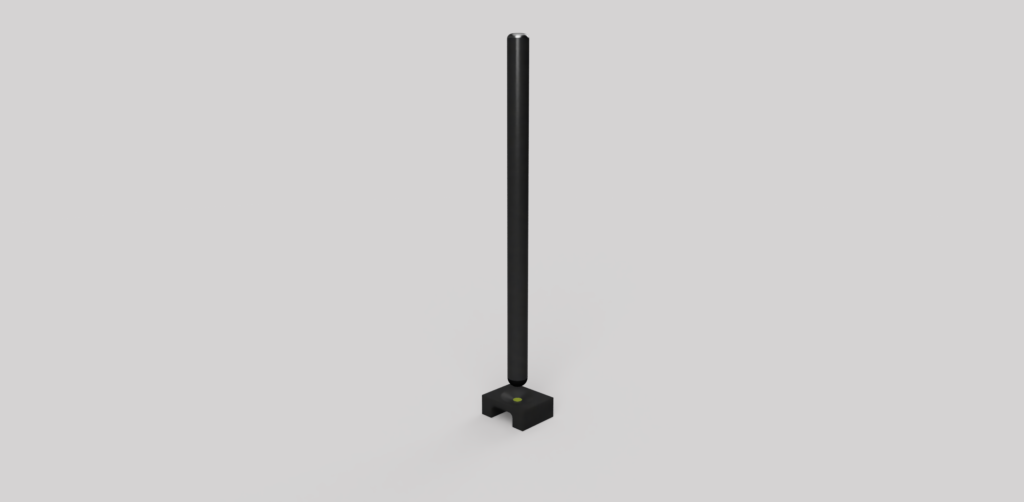
3D render of the Home, with a pen positioned on top.
We also created a stand for the Raspberry, made of transparent plexiglass, so that it can be visible but protected and have a defined spot in the installation.
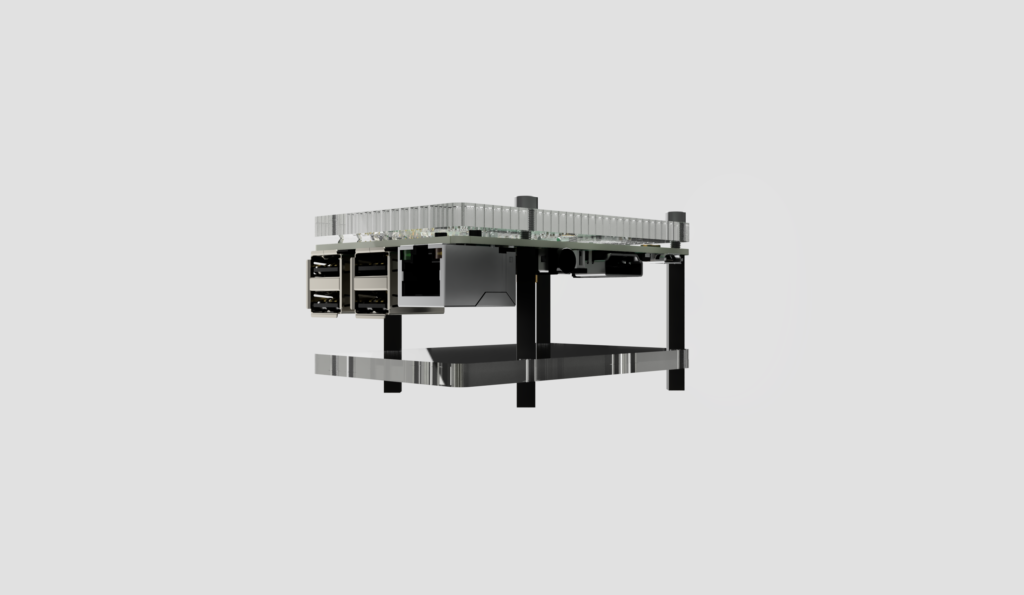
3D render of the Raspberry case.
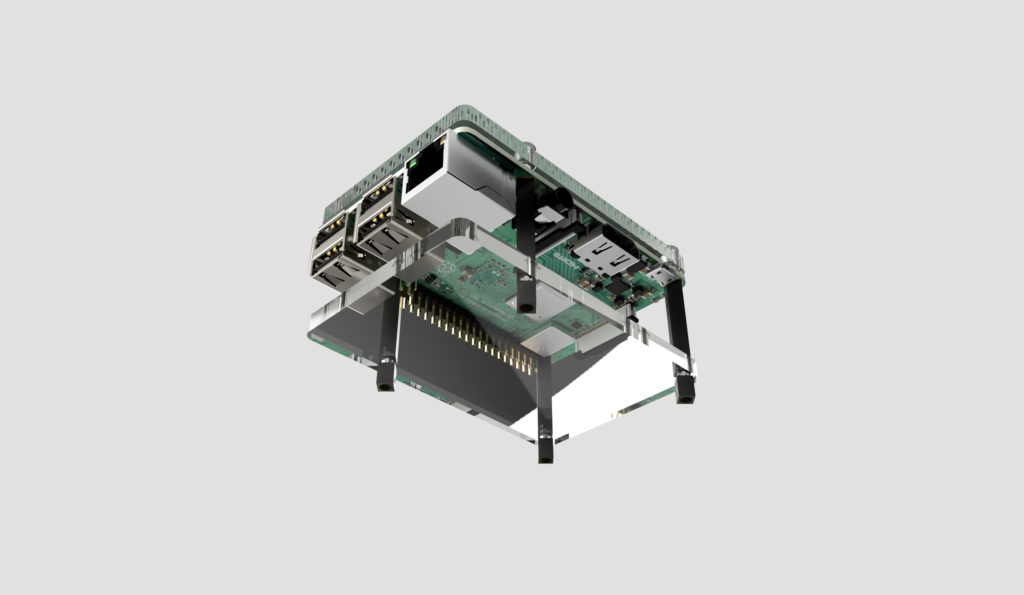
3D render of the Raspberry case.
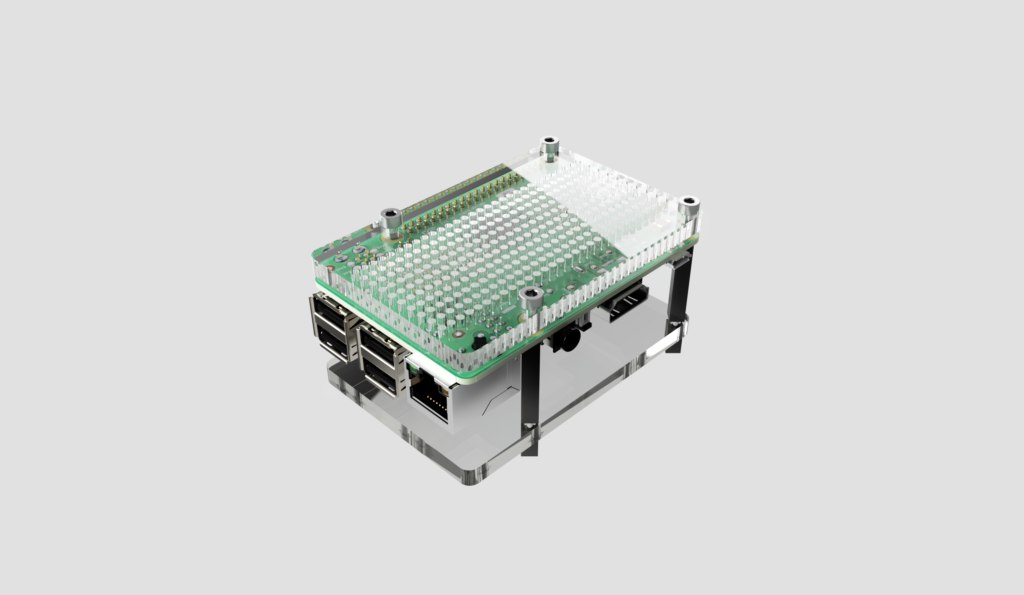
3D render of the Raspberry case.
To display the interface in full mode, after uploading the code to Github we created an app from URL in order to have a clean view of the full screen images.
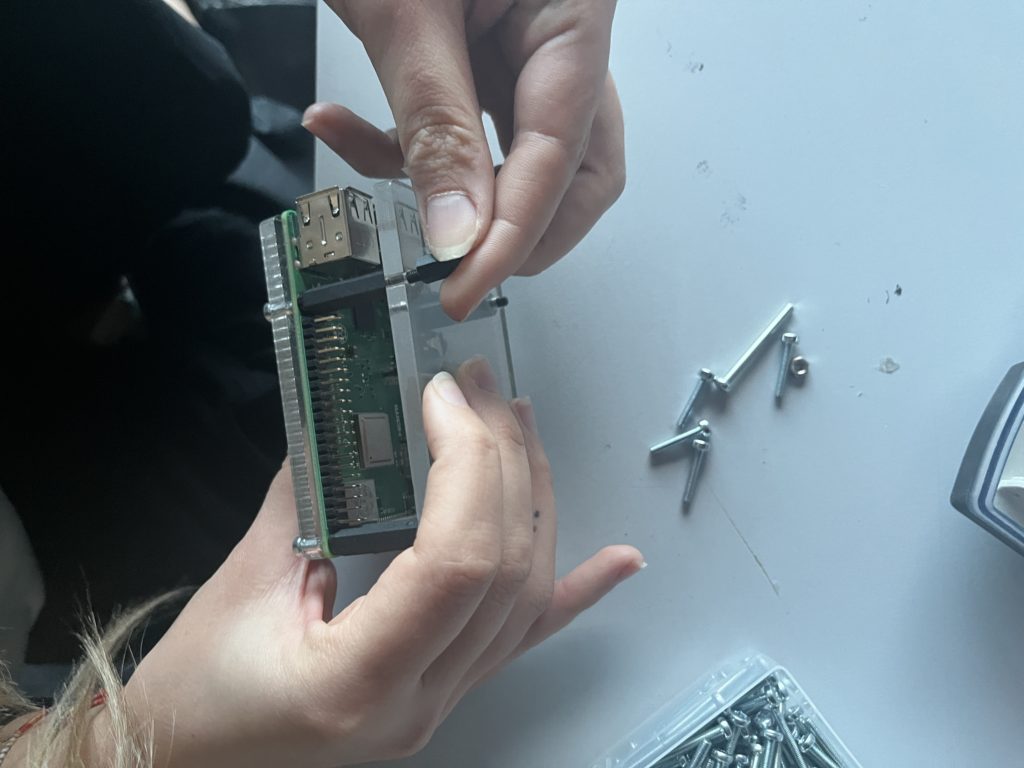
Maxing of plexiglass Raspberry cover.
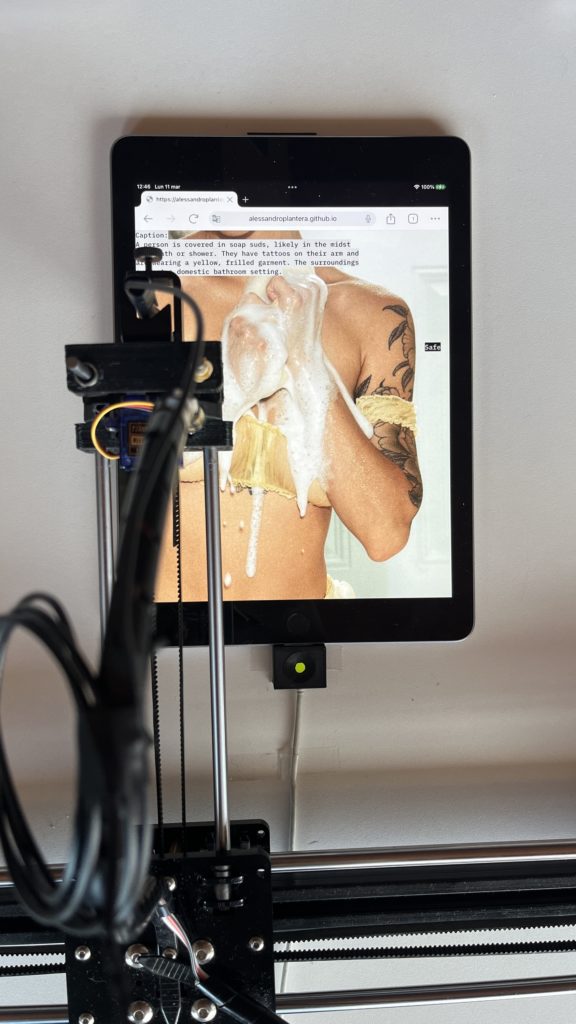
Before, visual working from browser.
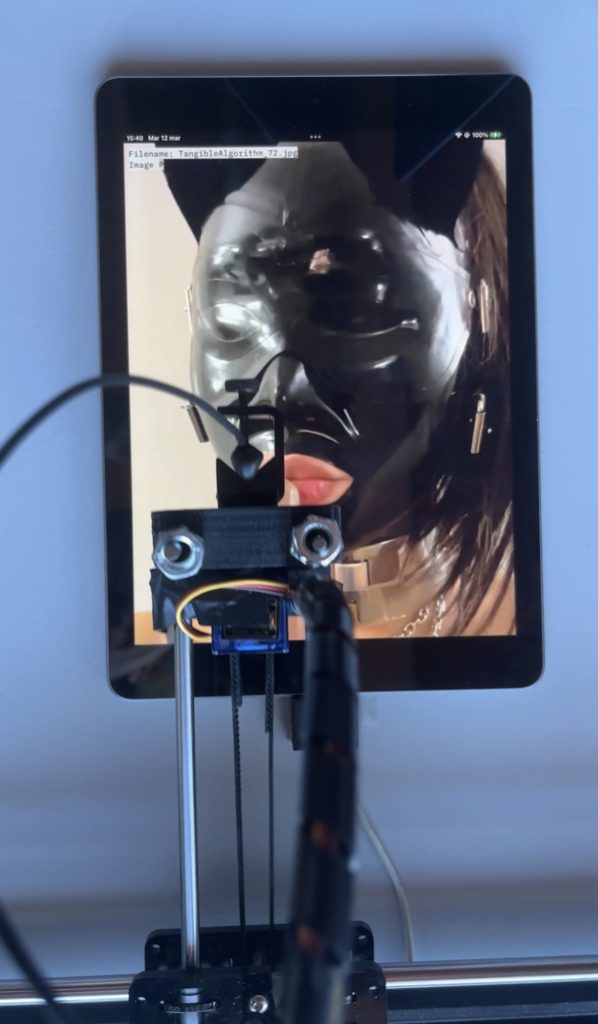
After, visual working from App.
References
AxiDraw commands (https://github.com/gnea/grbl/blob/master/doc/markdown/commands.md).
Barthes Roland, La camera chiara – Nota sulla fotografia, 1980.
Browser available sensors (https://developer.chrome.com/docs/capabilities/web-apis/generic-sensor?hl=it).
ElevenLabs, AI Voice Generator (https://elevenlabs.io).
Exposed website (https://www.exposed.photography).
GPT4 Vision (https://platform.openai.com/docs/guides/vision).
IBM Flex Sans Font (https://www.ibm.com/plex/).
Instagram profiles:
@ _thanyyyyyy (https://www.instagram.com/_thanyyyyyy/?img_index=1);
@bruisedbonez444 (https://www.instagram.com/bruisedbonez444/);
@disruptiveberlin (https://www.instagram.com/disruptiveberlin/);
@erotocomatose (https://www.instagram.com/erotocomatose/);
@hidden.ny (https://www.instagram.com/hidden.ny/);
@sensitivecontentmag (https://www.instagram.com/sensitivecontentmag/).
Instaloader, tool to download content from Instagram (https://instaloader.github.io).
Raspberry Pi 3 B+ (https://www.raspberrypi.com/products/raspberry-pi-3-model-b-plus/).
Recontemporary, exhibition space (https://recontemporary.com).
Supabase, free database service (https://supabase.com).
Turing Alan, Can digital computers think?, TS with AMS annotations of a talk broadcast on BBC Third Programme, 15 May 1951.
URL to App (https://routinehub.co/shortcut/10620/).